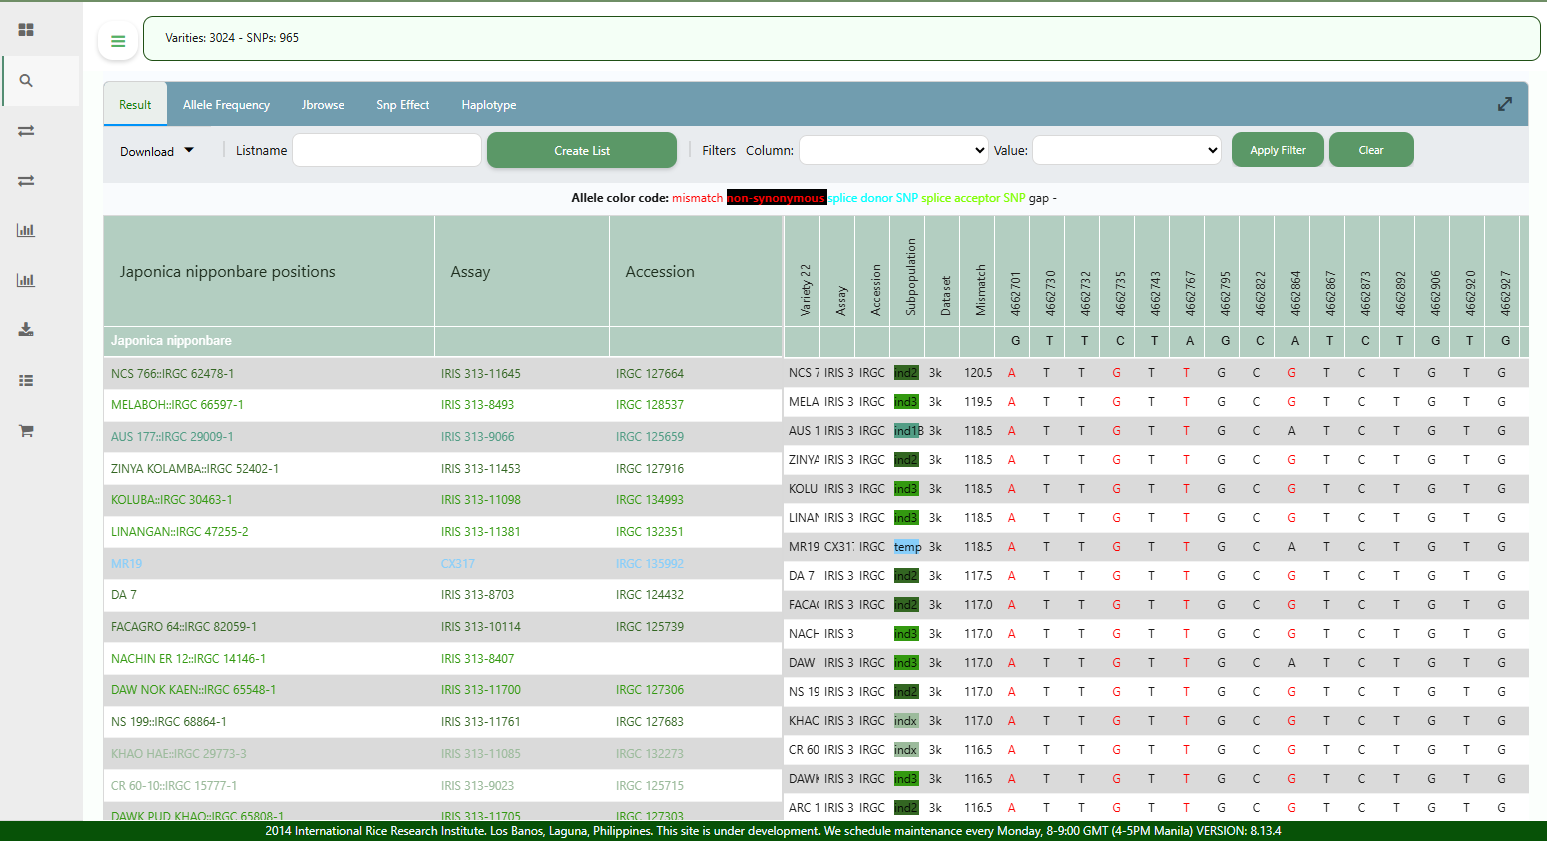
3. Query result
After querying the genotypes, you will have a table which displays the alleles for each 3KRG variety in a row, for all SNP positions within the specified region or gene. By default, the varieties are sorted by decreasing number of allele mismatches. The resulting table can be filtered using any of the column values, and sorted based on any column value by clicking the column header.
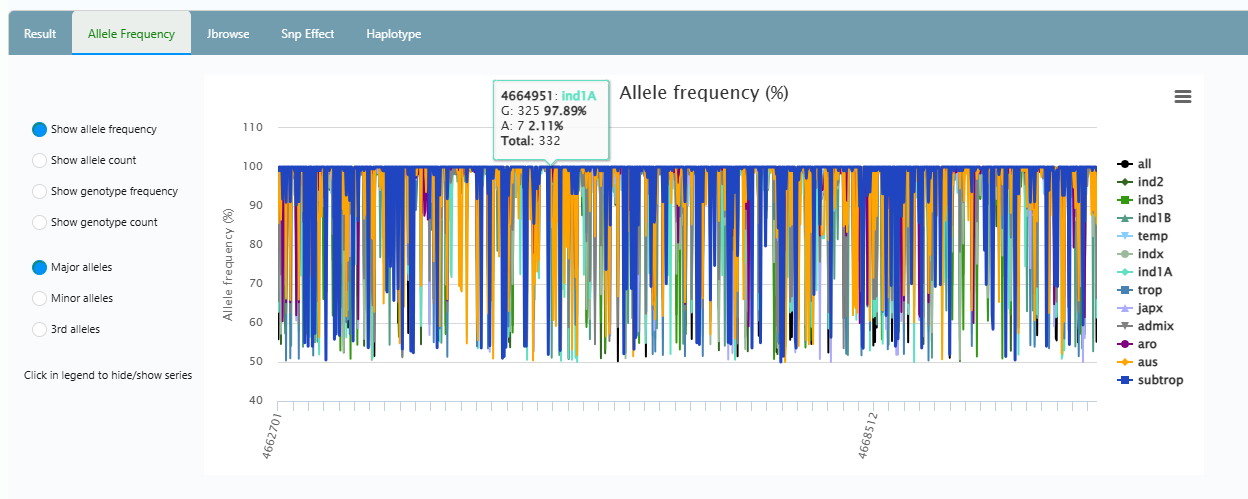
It will also report a graph of the allele frequencies where you can inspect the major and minor alleles per subpopulation for all SNP positions from the query.
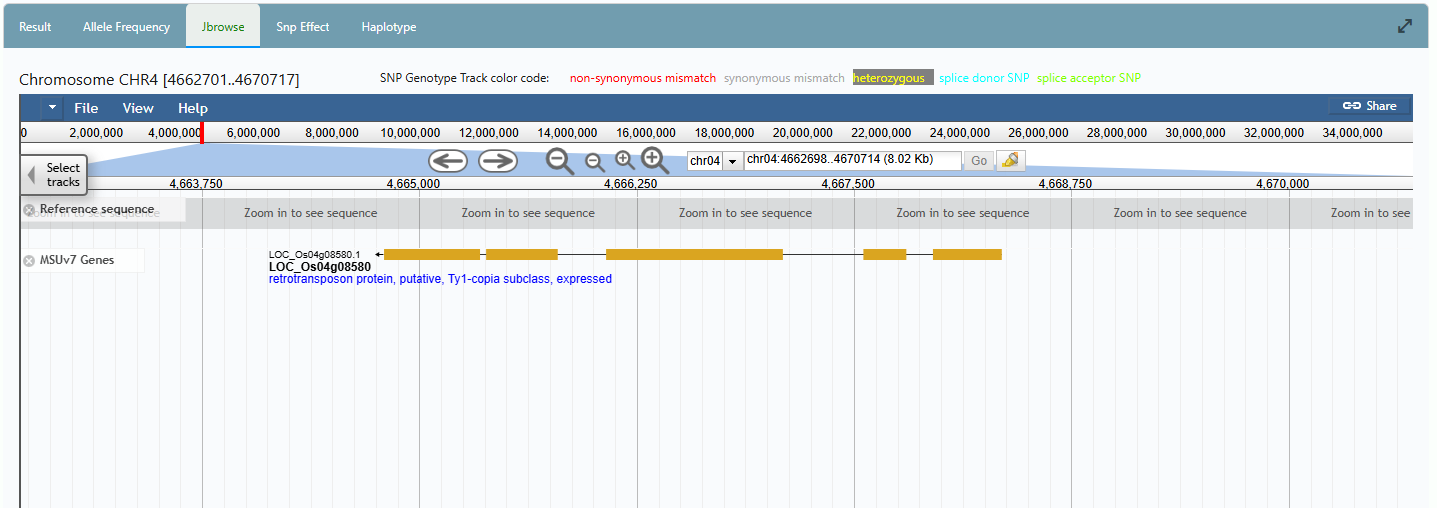
In another panel, you can also view the region in a genome browser.